Overview
All businesses rely on reporting functionalities to make strategic management decisions based on real-time information. Cin7 Omni's Inventory Success Quadrant gives key decision-makers a visual representation of their inventory performance by displaying products based on profitability and average stock days. It also identifies outliers to assist with profit margin improvements. You also can analyze data about suppliers, channels and stores, product categories, size variation, and retail and more.
For the purpose of explaining the Inventory Success Quadrant, this article will be broken down into two sections:
- The Grid
- The Data
Grid
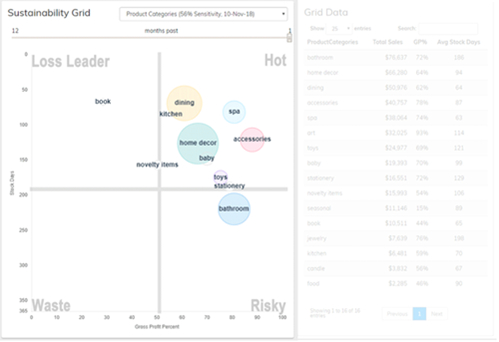
Quadrants
| Tile Name | Description |
|---|---|
| Loss Leader | A Loss Leader is a pricing strategy where a high quantity of products is sold however the gross profit is low. |
| Hot | Products found in this quadrant mean the average stock days are less than 200 and gross profit is greater than 50%. |
| Waste | This quadrant represents products that have generated less than 50% gross profit and have an average stock day count greater than 200 days. |
| Risky | Products displayed in this quadrant are generating gross profit higher than 50% however the average stock day count is greater than 200 days. |
Group by options
The group by options list, when expanded, shows a total of 10 "group by" options that provide you with the ability to view product performance based on different product groupings. In addition to this, a sensitivity percentage will appear next to each group by option.
| Name | Description |
|---|---|
| Suppliers | Groups products based on the supplier specified in the Purchase Order. |
| Channels | Groups products based on the origin of the order ie. Shopify, Backend, API, etc. |
| Retail Branches | Groups products based on the main branch specified in the sales invoice. |
| Project Names | Groups products based on the project name specified in the sales invoice. |
| Product Types | Groups products based on the product type specified in the products module. |
| Product Categories | Groups products based on the product type specified in the products module. |
| Sizes | Groups products based on product size. Product sizes are specified in the products module. |
| Sold At Retail Price Ranges | Groups products based on the Price Tier specified on the sales invoice |
| Online Price Ranges | Groups products based on channel origin. |
| Wholesale Price Ranges | Groups products based on the wholesale price tier. |
Sensitivity score
The sensitivity score is located in the group by option dropdown box. This score will help you determine outliers in the form of a quantitative value. Each score will be presented as a percentage. The closer the percentage value is to 100%, the more spread out the data will be. This percentage will allow you to quickly identify which group by option may require further investigation.
Data
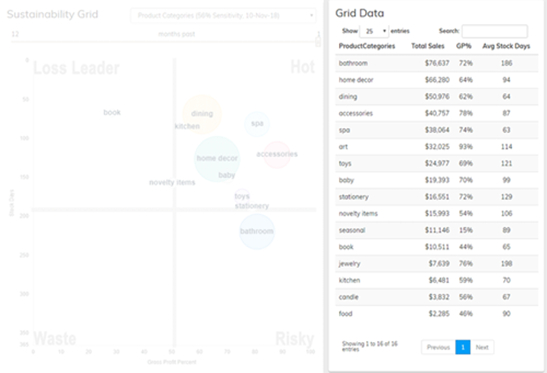
| Tile Name | Description |
|---|---|
| Entries Dropdown | This box allows you to specify how many rows you would like to see per page. |
| Search Box | The search box allows you to filter based on a keyword, meaning you can key in a keyword and the columns displayed will reflect any field with that keyword. |
| GroupBy Classification | This column will show the list categories based on the filter selected in the Grid. |
| Total Sales | The total sales column, by value, will display the tax excel sales value for the given time period. |
| GP% | The total GP% column, by percentage, will display the gross profit value |
| Avg Stock Days | The average days in stock are based on the earliest received date and latest dispatched date. |
FAQs
Where do I find the Inventory Success Quadrant?
This can be found in the Insights tab on the Dashboard. It is only visible to Admin users.
Can I alter the axis on the quadrant?
An admin user has the ability to specify the upper limit Y-axis and the X-axis. To do this:
- While logged in as an Administrator, select the cog icon bottom left.
- Scroll down to the Insights - Inventory Success Quadrant section.
- Select Save Settings to save any changes.